A Linux application can fail even when the server still has free disk space and available memory. The process may be unable to open another file, create a socket, spawn a child process, or accept a new connection. These failures can be confusing because the visible symptom may look like a network problem or an application bug, while the underlying cause is a resource limit.
Linux gives processes access to a finite set of resources. File descriptors, process counts, memory, CPU time, and kernel limits all affect how much work a service can handle. The effective limits may come from the user session, systemd unit configuration, container settings, or the operating system itself.
This tutorial focuses on diagnosing resource-related failures without guessing. It explains how to inspect open file descriptors, understand common errors, review service limits, and test changes safely. The examples are for learning and should be adapted to the distribution and service you are actually using.
- Understand What a File Descriptor Represents
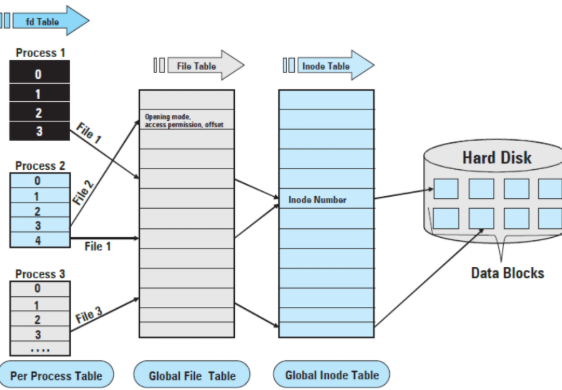
A file descriptor is a small integer used by a process to refer to an open resource. The resource may be a regular file, a directory, a pipe, a socket, or another object provided through the operating system's file interface. Standard input, standard output, and standard error are normally represented by descriptors 0, 1, and 2.
Web servers and network applications can use many descriptors at once. A server may have log files open, configuration files loaded, listening sockets, client connections, cache files, and communication pipes. Each active connection can consume one or more descriptors depending on the architecture.
If a process reaches its descriptor limit, an operation that needs a new descriptor may fail. The error can appear as “Too many open files,” often represented by EMFILE. In other cases, the system may reach a broader limit, or an application may fail because descriptors are leaked and never closed.
This is why raising a limit immediately is not always the right first step. A server that opens resources and never releases them may simply hit the higher limit later. First establish whether the current workload genuinely needs more descriptors or whether an application defect is causing them to accumulate.
- Check the Error and the Process State
Start with the exact message from the application or service logs. Look at the timestamp and the operation that failed. A message about opening a log file may point to different causes from a failure to accept a socket connection, even if both involve descriptors.
On a system using systemd, inspect the unit status:
systemctl status SERVICE_NAME
Then read recent service logs:
journalctl -u SERVICE_NAME --since "30 minutes ago"
Replace SERVICE_NAME with the actual unit name. Preserve the original error text and avoid assuming the first visible warning caused the failure.
Check whether the process is still running and whether it is repeatedly restarting. A unit may show active briefly while the application is repeatedly failing. A status page alone does not show whether the process can perform the expected work.
If the failure affects only new requests while existing connections continue, that can suggest a resource ceiling. If the entire process exits, inspect the exit status and service manager logs. If the process stays active but a specific operation fails, examine the application logs and the resources used by that operation.
- Count Open Descriptors
Linux exposes per-process information through /proc. If you know the process ID, you can inspect its open descriptors with:
ls -l /proc/PID/fd
Replace PID with the actual process ID. The directory contains symbolic links representing descriptors currently open by that process. Access may require appropriate permissions, especially when inspecting a service owned by another user.
You can count entries with:
find /proc/PID/fd -maxdepth 1 -type l | wc -l
This count is a snapshot, not a complete performance diagnosis. A busy server may open and close descriptors rapidly, so the count can change between checks. Repeat the observation over time and compare it with the service's normal workload.
You can also inspect the current shell's open descriptors with:
ls -l /proc/$$/fd
The $$ variable expands to the current shell's process ID. Remember that the shell and the application are different processes, so the shell's count does not describe the service's resource use.
If the descriptor count rises continuously and does not return toward its normal range after traffic drops, investigate whether the program is closing files and sockets correctly. The evidence should guide the next step rather than a single large count being treated as proof of a leak. When the investigation crosses into path ownership, mount points, or disk-backed files, this Linux filesystem concepts reference can help separate filesystem questions from process-limit questions.
- Read the Effective Limit
The shell's ulimit command displays or changes limits for the current shell and processes it launches. For example:
ulimit -n
This reports the current shell's soft limit for open files. To inspect the hard limit in the same shell, use:
ulimit -Hn
These values do not necessarily describe a service started by systemd. The process may have inherited different limits from its service configuration or supervisor.
For a running process, inspect the status file:
cat /proc/PID/limits
Look for the row labelled Max open files. It shows the soft and hard limits that apply to that process. Always use the process ID belonging to the affected service.
The soft limit is the operational limit that a process normally encounters. The hard limit is the upper boundary that an unprivileged process generally cannot raise beyond without the appropriate privileges. The exact behaviour depends on the resource and process credentials, so consult the relevant system documentation before changing limits.
The key lesson is to inspect the limit on the actual process, not to assume that a shell setting automatically applies to every service on the machine.
- Distinguish a Limit From a Resource Leak
A descriptor count that reaches the limit can have two broad explanations: the application legitimately needs more concurrent descriptors, or it is keeping resources open longer than intended. These cases call for different fixes.
Consider a service that creates one connection for every request but never closes the connection after the response. Under low traffic, the problem may be invisible. As requests accumulate, descriptor usage rises until new work fails. Increasing the limit may postpone the failure but does not correct the underlying behaviour.
By contrast, a server that correctly maintains many concurrent client connections may need a higher limit when traffic grows. In that case, the resource demand should be evaluated alongside memory usage, connection handling, operating-system limits, and the application's documented capacity.
Look for patterns. Does descriptor use climb steadily after startup? Does it drop when a workload ends? Are many descriptors pointing to deleted files, pipes, sockets, or the same log? Does the issue appear only after a specific endpoint is used? These observations help narrow the investigation.
If the application has its own metrics for active requests, connection pools, or file operations, compare them with the descriptor count. Resource use should make sense in relation to the work performed.
- Review systemd Service Limits
A systemd service can have settings that differ from those of an interactive shell. Inspect the effective unit configuration before editing it:
systemctl show SERVICE_NAME -p LimitNOFILE
This displays the configured LimitNOFILE property for the specified unit. Check the output for the current service and compare it with the limit seen in /proc/PID/limits.
If evidence shows the limit is insufficient and the application is designed to use more descriptors, a unit override may be appropriate. The mechanism commonly uses:
sudo systemctl edit SERVICE_NAME
A drop-in can contain a [Service] section with a LimitNOFILE= setting. The correct value depends on the application, its workload, system-level limits, and memory budget. Do not paste a large arbitrary limit into every service as a universal fix.
After changing a unit override, reload systemd's configuration and restart the relevant service during an appropriate maintenance window. A restart can interrupt active work, so understand the service's availability requirements before doing it.
Then verify the effective limit of the new process and test the original workload. The goal is to show that the service can perform the necessary operation without creating instability elsewhere.
- Understand the Wider Resource Picture
Open file descriptors are only one type of limit. Linux services can also be affected by process and thread counts, memory ceilings, CPU contention, disk latency, connection tracking, and container-specific limits. An application error may have more than one contributing factor.
For process activity, commands such as ps and top can show which processes are running and consuming resources. free -h reports memory and swap information. df -h shows filesystem capacity. ss -s provides a summary of socket usage, while ss -lntp helps inspect listening TCP sockets when permissions allow. For a wider command set covering interfaces, routes, DNS, and connections, see these Linux network troubleshooting commands.
Do not interpret a single metric without context. Linux uses available memory for cache, so a low “free” value alone does not prove memory exhaustion. A large process count may be normal for a workload using multiple workers. A large socket count may reflect expected concurrency or a connection-management problem.
Compare observations with a baseline from a period when the service operated normally. If no baseline exists, begin collecting measurements after the issue is resolved so the next investigation has a point of comparison.
- Check Containers and Supervisors Separately
A service running inside a container may have limits imposed at more than one layer. The host process may have one set of limits, while the container runtime or orchestration platform imposes additional constraints. A change to a shell or systemd unit outside the container may not change the effective limit inside it.
Check the application's actual runtime environment. Inspect the process and container configuration, then verify which limits are active from within the running process. Avoid assuming that the host and container see identical resource boundaries.
If the system uses orchestration, review the workload configuration and any relevant pod or container resource settings. A restart performed by a supervisor may replace the process and reset a resource count temporarily, which can disguise the pattern unless it is observed over time.
Change configuration at the layer that controls the limit. Document why the value was selected and how it was verified. Also consider whether increasing one resource limit could allow the application to consume more memory or other resources than the host can reasonably provide.
- Create a Safe Test Instead of Reproducing the Incident on Production
When possible, reproduce the suspected resource issue in a test environment with a controlled workload. Use a representative but non-sensitive dataset and avoid generating uncontrolled traffic against services you do not own.
The test should answer a specific question. For example: does descriptor use return to its normal level after the request completes? Does a controlled increase in concurrency cause the service to approach the current limit? Does closing the client connection release the expected resources? If you need a disposable cloud lab to practise these checks, review this Linux setup walkthrough for an AWS setup walkthrough for an AWS test instance and use a non-production environment with a controlled workload.
Record the starting conditions, command or test procedure, limit values, observed output, and result. Repeat the test so that random variation does not lead to an incorrect conclusion.
Do not use production as a stress-testing environment unless the operation has been planned, authorised, and bounded. A test that exhausts descriptors can prevent the service from accepting new connections and may affect other applications on the same host.
Once the cause is understood, change one configuration or code path at a time. Re-run the test and verify not only that the original error disappears but also that other resource measures remain healthy.
- Record the Finding and Prevent Recurrence
A good incident note should state the symptom, the affected process, the effective limit, the observations that supported the diagnosis, the change made, and the verification result. Keep the note short enough for another administrator to use but detailed enough to explain why the action was justified.
If the cause was a resource leak, describe the code path or behaviour that retained the descriptors and how it was corrected. If the limit was genuinely too low, document the expected workload and the basis for the new value. If a container or supervisor imposed the limit, record the layer where the configuration belongs.
Consider adding monitoring or an alert if the resource is important to service availability. An alert should reflect meaningful operating conditions rather than fire every time a normal usage pattern is reached. Where possible, monitor both the resource count and the user-facing error rate so that the team can distinguish a warning from an actual service problem.
Finally, review whether the incident exposed a documentation gap. If operators did not know how the service was started or which limits applied, improve the runbook. The next incident should start with better information than the last.
Conclusion
Linux resource-limit failures are easier to diagnose when you inspect the actual process, read its effective limits, observe resource usage over time, and connect that evidence with the failing operation. A high descriptor count alone does not distinguish legitimate demand from a leak, and a higher limit alone does not guarantee a lasting fix.
Use low-risk checks first, change the layer that controls the relevant limit, test the change under realistic conditions, and document the result. This method applies beyond file descriptors: it is a general way to reason about finite resources in Linux services.
Comments
Join the discussionNo comments yet. Be the first to comment.