Debugging Linux Services with systemctl and journalctl: A Practical Guide

Linux services run important background tasks: web servers handle HTTP requests, databases store application data, schedulers run jobs, and monitoring tools collect system information. When a service fails, the goal is not merely to start it again. The goal is to discover why it failed and verify that the application works after the fix.
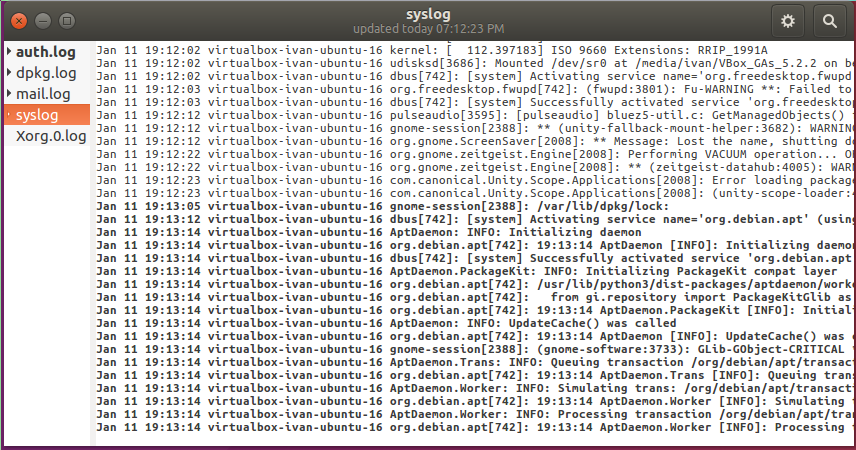
On many modern Linux distributions, systemd manages services and systemctl is the primary command-line tool for inspecting their state. journalctl lets administrators read log messages collected by the system journal. Used together, these tools provide a reliable first path for troubleshooting.

This guide uses an Nginx service as an example, but the same method applies to many other units. Service names, log availability and exact commands may vary by distribution, so confirm the details on the system you manage. Test unfamiliar commands in a non-production environment first.
- Start with the exact symptom
Before running commands, describe the issue as specifically as possible. Examples include “the web server does not start after a configuration edit,” “the service restarts repeatedly,” or “the process is active but the application returns an error.” These are different failure modes and need different checks.
Record when the problem started and what changed shortly beforehand. Was a package installed? Did a configuration file change? Did storage fill up? Did a certificate expire? A recent change is not necessarily the cause, but it gives you a sensible starting point.
- Check the unit status
Run:
systemctl status nginx
The output normally includes whether the unit is loaded, its active state, the main process and a small number of recent log lines. Possible states include active (running), inactive, or failed. A service can also be activating or restarting, which requires closer inspection.
Do not judge the entire application from the word active alone. The service process may be running while the site has a separate problem with DNS, firewall rules, upstream application code or a database. The status command answers the first question: is systemd reporting the service as running?
If you do not know the exact unit name, list matching units:
systemctl list-units --type=service --all | grep -i nginx
Use this to identify the unit instead of guessing names repeatedly.
- Read recent logs for the service
Next, inspect the journal:
journalctl -u nginx -n 100 --no-pager
The -u option selects the unit, -n 100 asks for the most recent 100 lines, and --no-pager prints the output directly. This is useful in an SSH session or when saving a short excerpt for later review.
To follow new log entries while reproducing a problem, use:
journalctl -u nginx -f
Stop the live view with Ctrl+C. If the issue happened at a known time, apply a time window:
journalctl -u nginx --since "2026-10-09 09:00:00" --until "2026-10-09 10:00:00"
Adjust the dates and times to your incident. Avoid sending a large, unfiltered log dump to a public forum, because logs may contain usernames, internal hostnames or other sensitive data.
- Look for the first meaningful error
The final line may say that the service failed, but an earlier entry may show the reason. Search for clues such as permission errors, a missing file, an invalid directive, address conflicts or a dependency that did not start. Examine the surrounding lines rather than taking a single message out of context.
For a text log file, grep can help:
grep -Ei "error|failed|denied|invalid|address already in use" /var/log/nginx/error.log
The file path depends on the configuration and distribution. Confirm that the file exists and is the active log before using a command copied from an example.
If the log output is too broad, narrow the time range, search for a specific request or compare the messages with the time you reproduced the problem. A disciplined search is more useful than treating every warning as a failure.
- Test configuration before restarting
A service may fail because the configuration syntax is invalid. For Nginx, a syntax test can be run with:
nginx -t
Read the full output. If it identifies a file and line number, examine that part of the configuration before editing. Keep a backup or use version control so you can compare changes. Never overwrite a working configuration without preserving a way to recover.
Different applications provide different validation commands. Check the relevant documentation for the service you are managing. After correcting a file, repeat the configuration test before reloading or restarting the process.
A reload is usually intended to apply supported configuration changes while keeping the service available, whereas a restart stops and starts the service. Whether a reload is appropriate depends on the software and the nature of the change. Do not assume every service supports the same behavior.
- Check listening ports and dependencies
If the service is active but clients cannot connect, inspect listening sockets:
ss -tulpn
To focus on a common HTTP port, you can filter the output:
ss -tulpn | grep ':80'
A port conflict occurs when another process has already bound to the address and port the service needs. Identify the process before taking action. Stopping an unfamiliar process could interrupt another application. A Linux networking command guide provides additional examples for checking interfaces, ports and connectivity.
Services may also depend on a database, cache, application server or network resource. Check the status and logs of relevant dependencies. The root cause may be outside the service that first reports failure. A web server can be healthy yet return an error because the application upstream is unavailable.
- Check resources and permissions
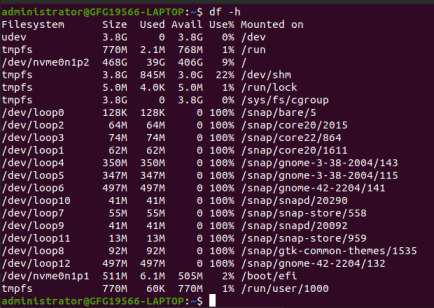
Storage problems often cause indirect service failures. Use:
df -h
If a filesystem is full, find which directories are consuming space before deleting anything. Log files, uploads, temporary files and backups may all contribute, but they should not be removed blindly.
Check memory and CPU if the service is slow or repeatedly killed. Tools such as free -h, top and ps can help identify pressure or a process consuming unusual resources. A single high reading is not enough to prove the cause; compare it with the normal workload and the time of the incident.
Permissions can also prevent a service from reading a configuration file or writing to a directory. Use ls -l to inspect ownership and mode bits. Fix the specific access problem rather than applying overly broad permissions such as 777.
A basic Linux filesystem reference can help when deciding where configuration, logs and application files are commonly located. It is still important to confirm the actual paths on your distribution.
- Verify the fix from the user's point of view
After a change, check the service again:
systemctl status nginx
Then perform a real application test. If it serves a local HTTP page, try a request from the server using a suitable URL. Test externally as well, because a local response does not confirm DNS, firewall or public network access.
Watch the logs while making the test. If the same error returns, the issue may not be fully resolved. Record the successful check so there is clear evidence that the service and the intended user journey work.
For a cloud-hosted site, a practical AWS EC2 website deployment guide can help place service troubleshooting in the context of instance configuration, security groups and web-server setup.
- Turn the incident into documentation
When the service is stable, record four items: the initial symptom, the evidence you found, the root cause and the change that fixed it. Include relevant commands and expected output, but remove secrets and personal information. This creates an incident note that can help you or another administrator recognize the same pattern later.
If the issue occurred after a deployment or configuration change, note which change was involved and how it was validated. A small record can also help identify repeated failures that point to a deeper problem, such as recurring disk pressure or an unreliable dependency.
Account for dependencies and startup order
Some services need another service or resource to be ready before they can work. A web application may require a database, network mount or secret available at startup. If the dependency is unavailable, the logs may show connection failures even when the service's own configuration is valid. Look at the dependency's status and timing before making repeated changes to the first service that reports an error.
Where the application supports health checks, use them to verify readiness instead of relying only on process existence. For example, a process can run while its HTTP endpoint returns an error because an upstream dependency is unavailable. Keep the difference between process state and application health clear in incident notes.
Final thoughts
systemctl and journalctl work best as part of a repeatable process: define the symptom, inspect status, read the relevant logs, test configuration, check ports and dependencies, review resources, apply one targeted change and verify the outcome. That process protects useful evidence and reduces guesswork.
Linux administration becomes more reliable when fixes are based on observations rather than assumptions. Learn to read the output, record what you discover, and confirm that the actual service works after each change.